7 week_07 - Classification Continue
7.1 Summary
In the previous week we have discussed about image classification that operated per pixel. However there are some drawbacks of this method which we are neglacting adjacency aspect meanwhile in geographic law, anything is related and near things are more related. Moreover, it is rare to have pure homogeneous pixel which mean in a single pixel it can consist of various land cover. Recalling a little bit from last week learning diary, at the end of summary I have mention some consideration before we classify EO image. One of the consideration is whether we are going to classify object or pixel or even sub pixel. In this week we still going to discuss about image classification methods, we are going to discuss about other image classifications which are not operate on pixel base. Instead of discussing classification in pixel based, we are going to discuss Object based Image Analysis (OBIA) and sub-pixel Analysis.
7.1.1 Object Based Image Analysis (OBIA)
As we discuss above, per pixel classification just take individual pixel into account, it is not considering adjacency and similarity. Object based analysis comes as an alternative that instead of operating classification per pixel, it is better to make it as per object. Objects or Superpixels or Supercells is shape on the image that grouped together based on the similarity (homogeneity) of adjacent pixels. Ultimately, the idea of OBIA is turn image into smaller objects, calculate mean value of each objects and classify the object.
However. How to turn our image into objects or superpixels? one of the most common method is SLIC (Simple Linear Iterative Clustering). Here is steps of superpixels generation using SLIC:
- Given an image
- Place number of points in the image
- check on parameter which are distance and similarity. Those points will become centroid to:
- Look at the distance of two pixels
- Look at the similarity (homogeneity) of near pixels
- If these 2 parameters are accomplished, then a boundaries will be drawn to identify as one object
- Iteration by changing the distance and similarity parameters
The hyperparameter or what we can set for this object generation iteration are: - distance between 2 points (s) - compactness (m) or balance between pixel distance and colour
The output is objectified image like shown below.
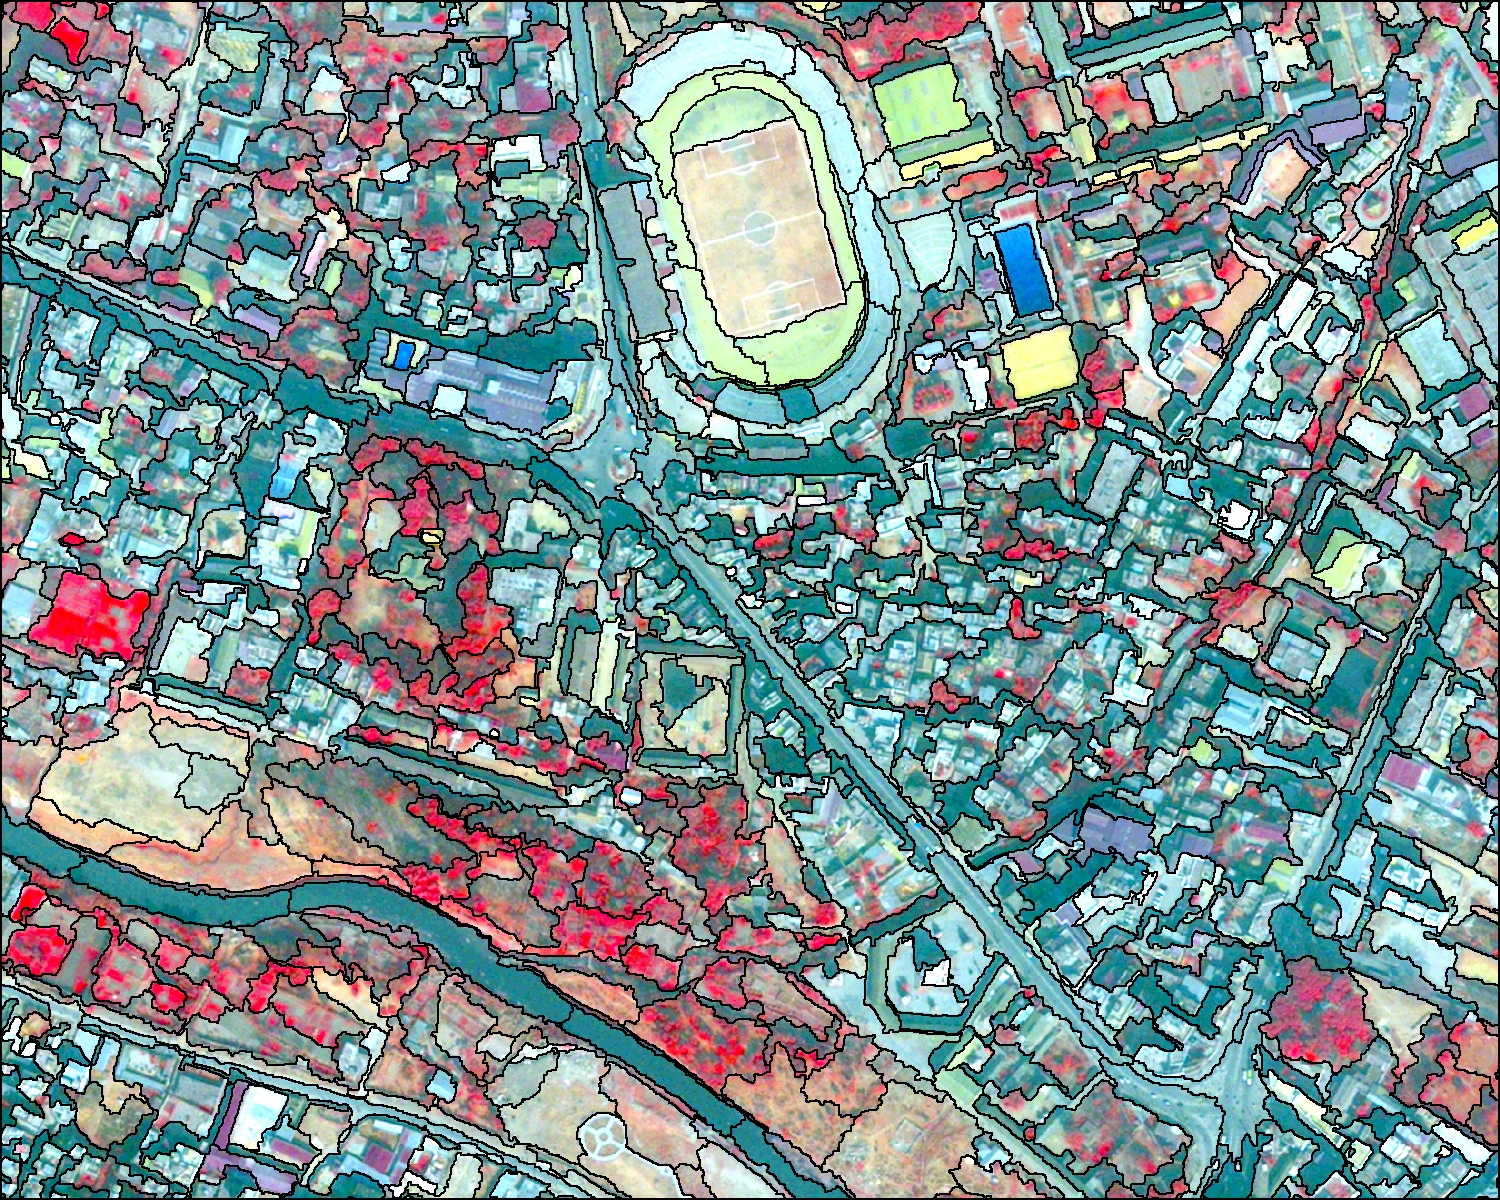
source: SegOptim performing object-based image classification
This is not the final output of our classification but it will be the input for classification method. After generating this image we can calculate the average value of each object and use those value to do classification as we learn last week.
7.1.2 Sub-pixel Analysis
In EO imagery, it is difficult to have homogeneous pixel. A pixel can contain many different information or land cover type. Thus, it will be beneficial to learn about Sub Pixel Analysis because we can see percentage of different land cover type on a pixel.
Sub pixel analysis is also known as sub pixel classification, spectral mixture analysis (SMA), or linear spectral unmixing. We treat pixels as combination of land cover fractions. In this analysis, ultimately, we take an individual pixel and estimate fraction (percentage) that make up that pixels. for example we will estimate how many percent vegetation, water, and bare soil in the pixel we have. the image below is the example that a pixel is a mixing of 70% vegetation, 20% water, and 10% bare soil
![]()
source: Pérez Machado and Small (2013)
The way we calculate percentage of fraction is by taking Spectrally Pure Endmember. Spectrally Pure Endmember is pixel that has homogeneous land cover or the purest pixel that has nothing else within it. However, it is difficult to have pure endmember. Thus, sometimes we use spectral library as the pure endmember. The pixel we have is a combination of various endmember.
Although machine will do the calculation for us, it will be better to understand whats going on to calculate sub pixel analysis. What we are going to find is percentage of each endmember. So here is the step to calculate fraction: 1. the basic formula is our band value equals to endmember’s band value multiply with fraction proportion.
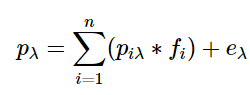
- *pλ* is our pixel band value
- *piλ* is band value of endmember
- *fi* is percentage of fraction- To make the explanation easier we will use band 3 and 4 from our pixel and endmember. Since we use 2 bands we then turn the formula into a matrix which will look like this
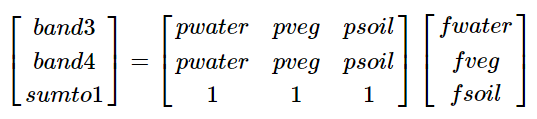
- Since we want to know the f value for each fraction of endmember, we have to invers the matrix. Thus, the equation will look like this. (ps. we already put the band value)
- the calculation will give us the percentage of each end member
The output is percentage of each endmember. Using the given percentage we can make a map that has fractions. It will be usefull because we can analyse fraction of each endmember on particular area. We can use the result for analysis with other aspect, such as air pollution, public health, etc.
There are various ways to identify combination of endmember fraction. One of the common ways is using V-I-S model. VIS model means Vegetation-Impervious surface-Soil (V-I-S) fractions. it is shown in the triangle diagram below. We can identify pixel’s land cover based on this VIS triangle.
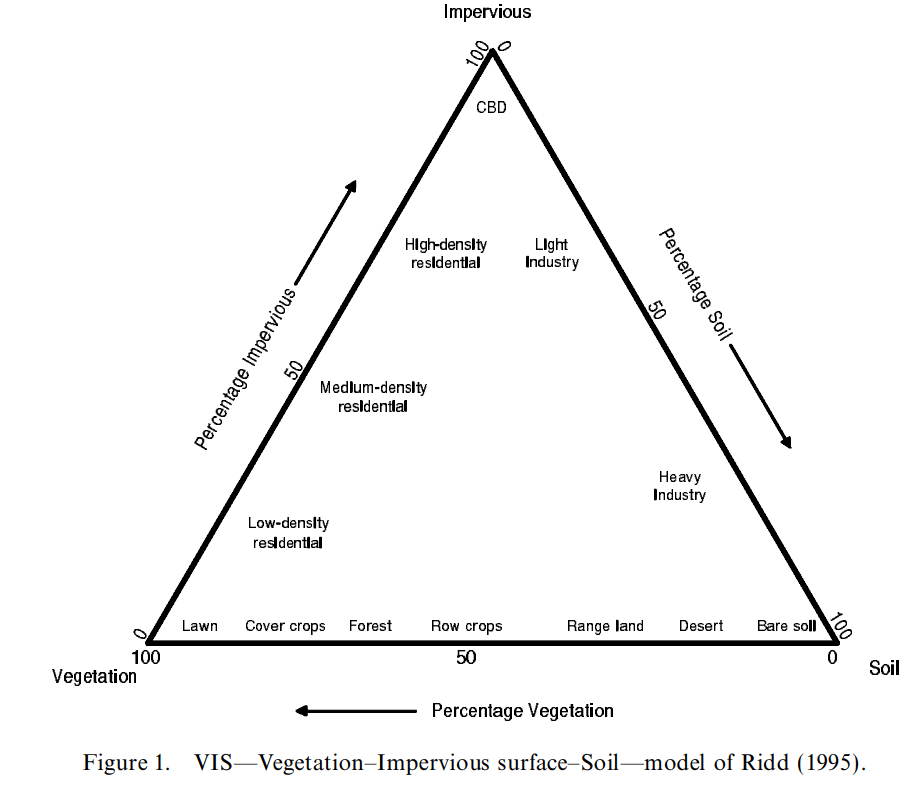
source: Plaza et al. (2002)
7.2 Application
Learning about further image classification based on object and sub-pixel are really interesting because we can develop our analysis further. I will discuss examples of OBIA and sub-pixel analysis.
7.2.1 Sub-pixel Analysis Application
7.2.1.1 Multiple endmember spectral mixture analysis (MESMA)
Real advantage of sub-pixel analysis is we can see the fraction of a pixel. We can utilise this benefit by classifying spectrum of a pixel so instead of having binary classification we can have more continuous value. Eckmann (2009), utilise the benefit of sub-pixel analysis to develop a new method on estimating size and temperature of forest fire. Previously, Advanced Spaceborne Thermal Emission and Reflection Radiometer (ASTER) were utilised to detect binary whether there is fire or no fire. Proposed methods used Multiple endmember spectral mixture analysis (MESMA) to estimate subpixels, fires sizes, and temperatures of forest fire that happen in California on 14 September 2006.
The methods applied MESMA on ASTER night-time image on 15 September 2006. Similar to Spectral Mixture Analysis (SMA), MESMA analyse sub-pixel or fraction of pixel, but this methods can do analysis using more then 2 bands. Thus, MESMA can utilise the advantage of ASTER which is has more than 2 band by involving band 4, 5, 6, 7, 8, and 9.
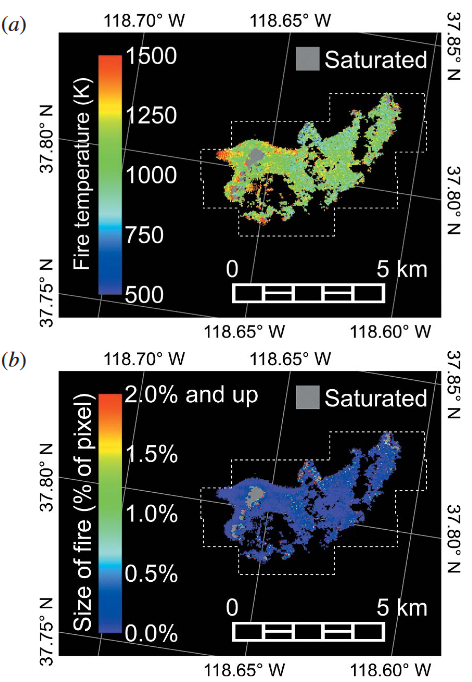
source: Eckmann, Roberts and Still (2009)
The output of this analysis is maps of fire size (image a) and temperature (image b). However, this research assumes only one single fire temperature per pixel. Estimating fire temperature will lead to another research because fire temperature influence gas and aerosol emission, ecological impact, and spreading rates. MESMA methods can be beneficial for countries that has a lot of peatland like Indonesia and Malaysia, because it is prone to combustion. Country governement can use this methods on near-real time dataset to handle fire combustion.
7.2.1.2 Urban Surface Emissivity
Similar methods on using sub-pixel analysis to estimate temperature also done by Mitraka (2012), in mapping urban surface emissivity in Crete, Grece. However, this research only needed to use ASTER image band 13. Thus, instead of using MESMA, it only use SMA. Surface emissivity (or temperature) is really depend on the surface type and physical condition so it is good use sub-pixel analysis. The benefit of using this method is ability to hadle mixed pixel so we can capture various biophysical parameter in a pixel.
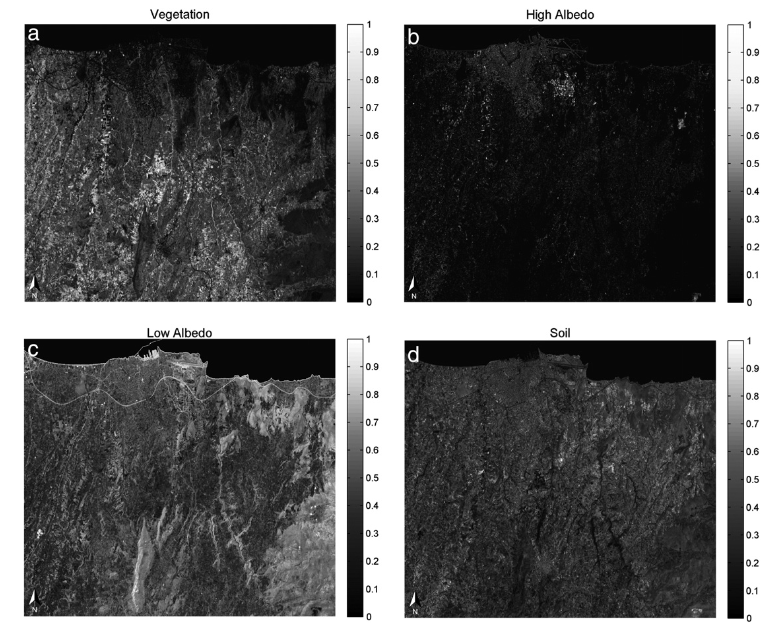
source: Mitraka et al. (2012)
Learning about sub-pixel analysis on surface emissivity is really beneficial because high earth temperature is a global issue that being faced by every country. Surface temperature increase can caused the increase of energy consumption up to 8.5% and affecting citizen health and well being (Santamouris et al., 2015). Making surface emissivity map helps city planner and decision maker finding the right solution to cool down the earth. Although, this study present a really beneficial methods, it used only one date image. Meanwhile in assessing heat in a city we might need maximum temperature value. Further study has to be done to check whether this methodology robust or not. Therefore, in the further study of this methods we have to use dataset various date to have a better result.
7.3 Reflection
- Learning about OBIA and sub pixel analysis are really beneficial because there are some cases that per pixel image classification is the best fit.
- Object based Image Analysis we are considering pixel simmilarity and adjacency, so it will be better to have object classification
- Learning about sub pixel analysis is really beneficial because in a single pixel mostly it always contain various land cover. Using sub pixel analysis we can specify mixing of various land cover in a pixel. It gives us continuos value, instead of binary category like shown in the fire detection.
- Understanding fire temperature estimation using MESMA are really beneficial for tropical country that has a big forest or peatland are. Local government can utilize this to mitigate forect combustion.
- Overheatting earth surface is global issue that affecting social, economy and environmental aspects. Thus, every countries government try to cool down their land. However, to take a right decision, local government has to assess the temperature based on their surface type and physical condition. SMA methods is really beneficial here because it can helps local governement estimating their surface temperature
- We have to be critical on the research or paper we see because an innovative methods is not always a robust replicable one. We have to check did this methods have been studied in the right manner and do this methods appropriate for our problem.