5 week_05 - Google Earth Engine
5.1 Summary
In this week we are going to learn about Google Earth Engine (GEE). We will discuss about GEE in 2 section. First, we are going to learn about brief introduction about GEE. Second we are going to discuss about one of processes we can do in GEE which is Reducing Image
5.1.1 Google Earth Engine Introduction
Google Earth Engine (GEE) is a geospatial processing server developed by Google. It allows geospatial analysis with massive raster or vector dataset that has Landsat and sentinel dataset from time to time. It allows to handle massive data store with a fast respons because all the data are stored on the server. GEE has client side and server side. Client side is what user see or frontend, meanwhile server side is the backend where GEE store all the data as Earth Engine object or identify as ee. In the GEE script, if we found anything with ee it means that it is stored in the server. Client side is place where GEE collect input from the user and after that the input will be processed in server side.
5.1.2 Google Earth Engine Interface
Interface of Google Earth Engine will look like this:
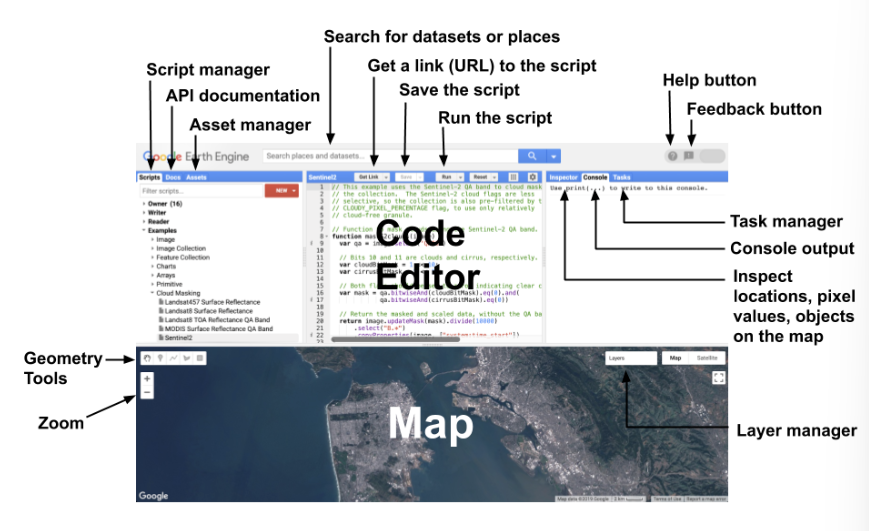
source: GEE
- Assets is where we upload our data- Documentation is documantation
- Code editor is where we put our script
- Tools is tools helping navigating maps
- inspector quiery the map itself and get some information
5.1.3 How Google Earth Engine works
Before we go further to talk about any processes we can do in Google Earth Engine, it’s better to know how GEE works. Unlike previous week and term when we use R and python, GEE is using javascript. Thus, we can not do looping like what we usually do, instead in javascript we use mapping. Mapping is making function and save it into an variable (or object) and applied to the entire collection. But, what is variable and object? in Javascript variables are container of data value written as var. Object is also variables but can contain many data values. Go check w3schools explanation on object and variable.
In GEE, there are 9 types or classes of objects which are shown in the image below:
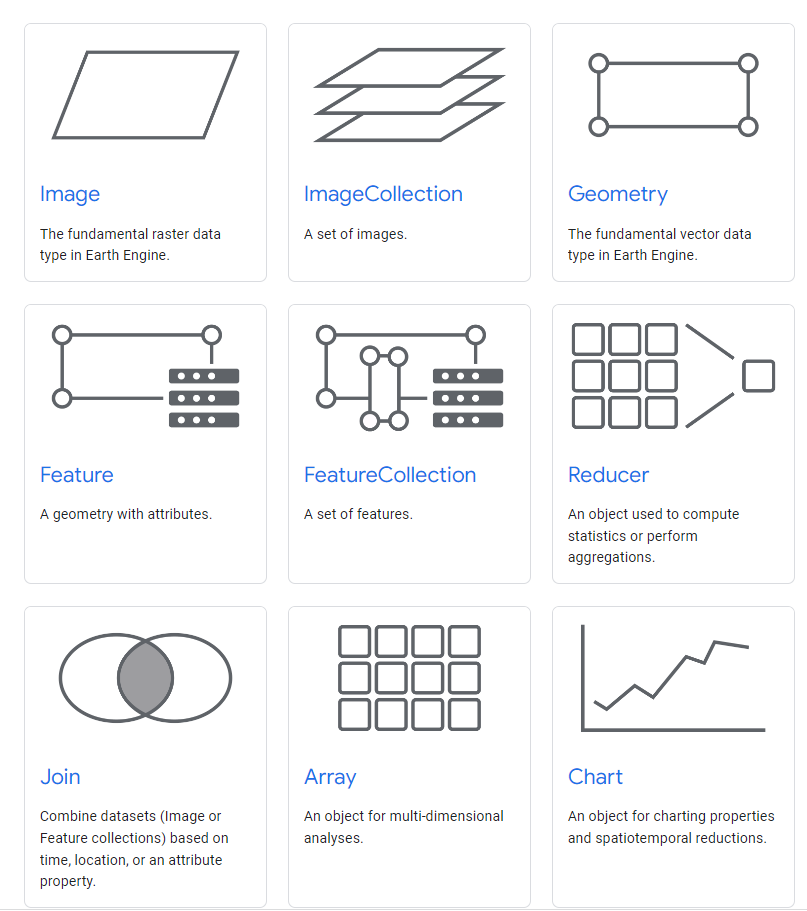
source: Objects in Google Earth Engine
It’s good to be familiar with object terminology in GEE because in the next section and next week we will use these terminology a lot. individual Landsat or satellite scene, which is a raster, is known as Image. - Image is raster data or individual satellite imagery scene - Geometry is vector or we know it as polygon - Feature is vector data with attributes (table or metadata) - Collection is stack data means that we have more than 1 (plural) data. So collection can be: - FeatureCollection which is stack or collection of vector data with attribute - ImageCollection which is stack or collection of raster image data
These 9 class of object also cover data manipulation which are: - Array is for multi-dimensional analysis - join is to join 2 or more dataset, and it also can be used to join imagery collection together from different sensor (such as: Landsat and sentinel) into one massive stack - Reduce is taking lots of data andsummarise into 1 point (it similar to filter or texture measure) - Reducer we will discuss this in the next section
Each class of object has specific GEE function. The function is name of the object class with additional ee. in front of it, so for example it will look like this: - for Image use ee.Image - for image collection use ee.ImageCollection
In GEE, we do not need to worry about projection because by default it will be set to EPSG 3857. Only if needed (eg: if we want to load in R) we can change the projection at the end.
After we understand brief information, interface and how GEE works, we can discuss further about one of methods or process that can be done in GEE. This process is Image Reducer. We will find this process beneficial because this methods helps reducing massive datasets that we are often dealt with in GEE analysis.
5.1.4 Reducing Images
Working with GEE allow us to work with multi-sensor and multi temporal data. It makes us tempted to work with with massive collection of imagery data. GEE develop an image reduction tool to summarise collection of image into 1 image composite using ee.Reducer
There are some reduction methods we can do which are: 1. Reduce with median 2. Reduce by region 3. Reduce by Neighbourhood 4. Reduce with Linear Regression
We will discuss this methods one by one
5.1.4.1 Reduce by Median
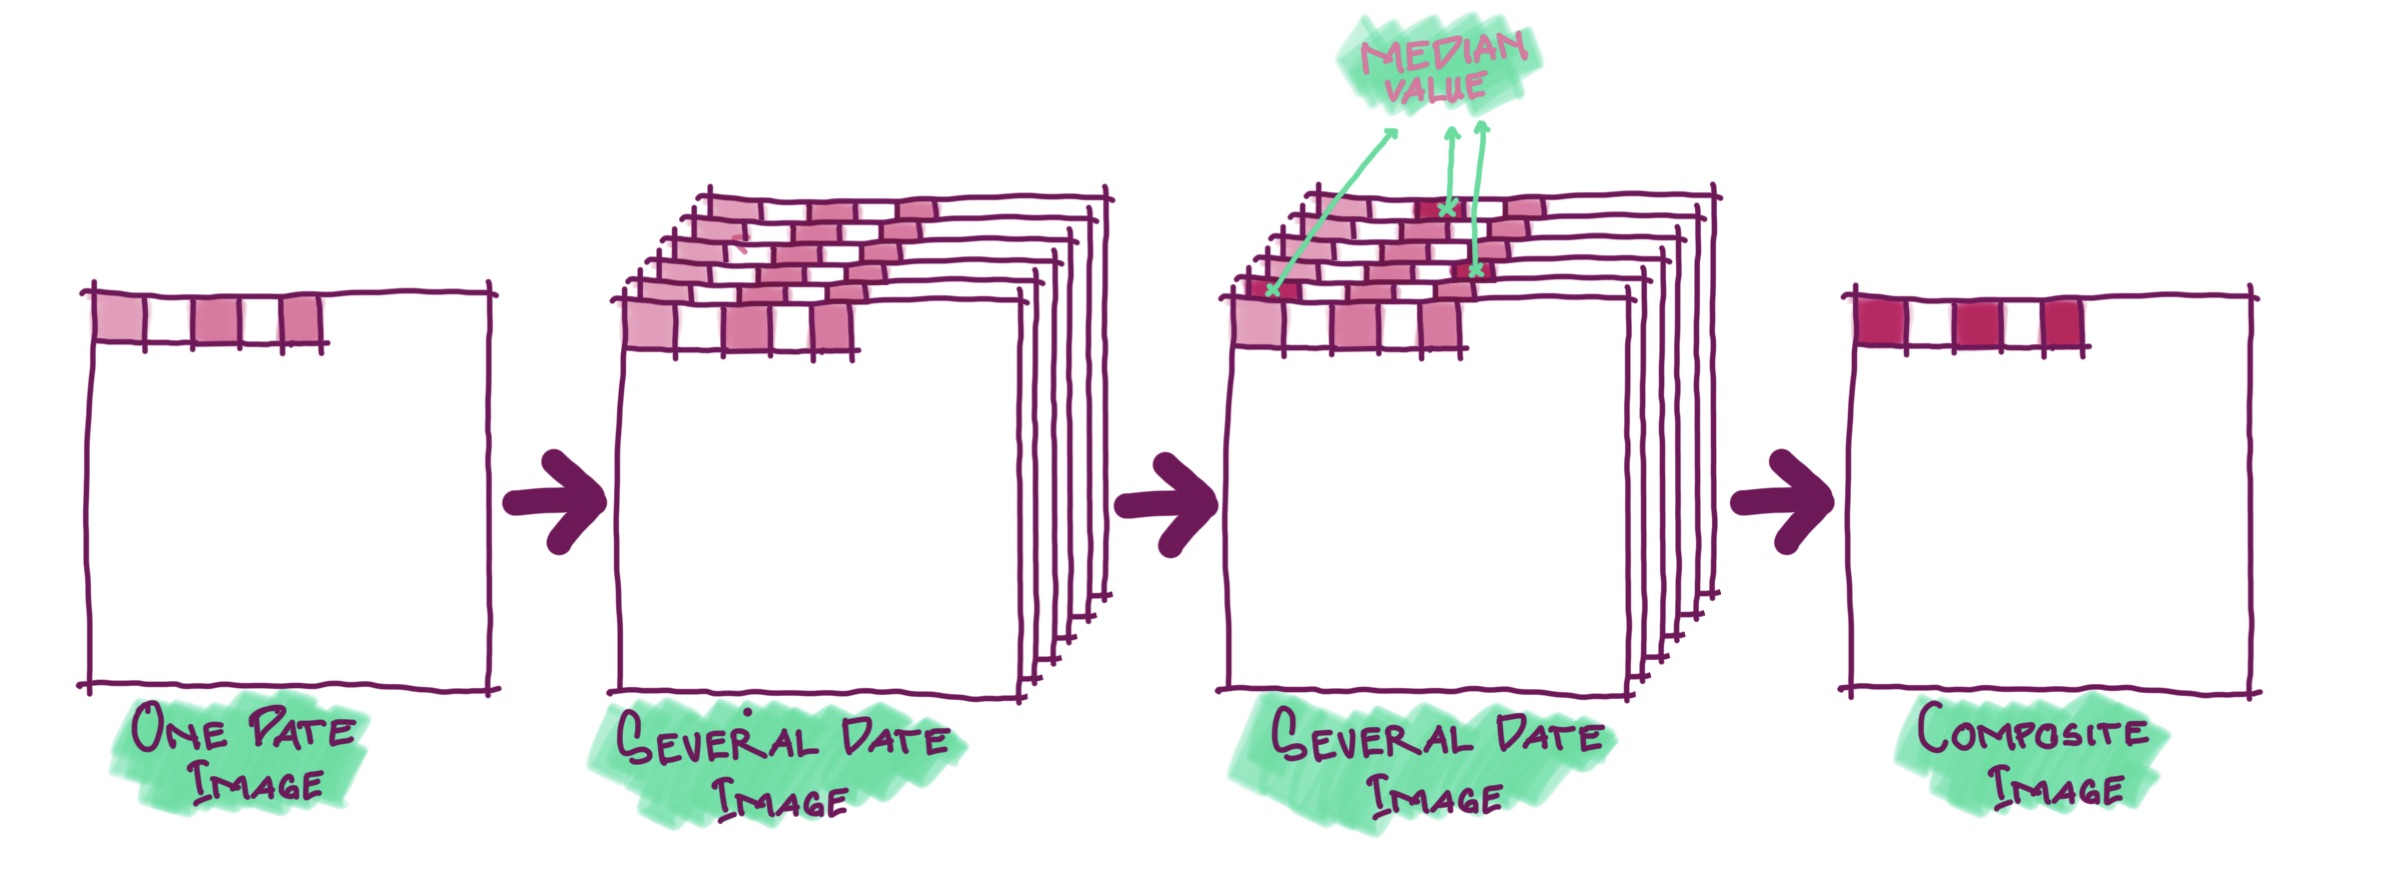
The case to use this technic is if we have lots of collection images but we only want to classify 1 image composite. Typically what GEE will do is take the median value of each pixel to make an Image composite. For instance, we want to analyse a study area in january 2023, we have image collection from several dates in January. GEE will check value of each pixel from different date and find the middle value. Afterwards, GEE will compose a new image from those median value. The median value of composed image might come from different date.
Although this methods commonly used (even by the lecturer, Andy), (Citation Hansen) argue to this methods of image reduction because if we only take median value it is possible to loss a lot of information. Thus, instead of using meding, he suggest to use decile.
5.1.4.2 Reduce by Region
Other technic of reducing image is by region. Reducing image by region can be beneficial if we have massive dataset and want to do statistic analysis on one specific study area. For instance, we want to calculate average reflectance for each band within London (the study area). What we can do is taking polygon (or using .shp file) boundaries of a region, in this case London. A region boundary possibly has a lot of pixel within. Afterwards, GEE will reduce the image by calculating mean value of each pixel within the region boundary.
Reduce by region can be done for one study area or many study area (many polygon boundaries) using: - image.reduceRegion() for 1 study polygon - image.reduceRegions() for more than 1 study polygon
5.1.4.3 Reduce by Neigbourhood
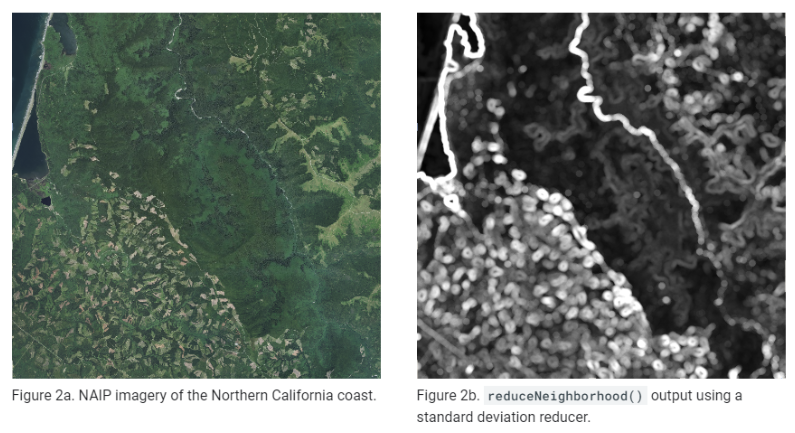
Instead of using region boundary, we can use Kernel neighbourhood to reduce the image. In this reducing methods is kind of similar to filtering and texture enhancement that we learnt in Chapter 3. Basically, the methods is we ask GEE to summarize the image by calculating either mean, median, min, or max value of the neighbour. Neighbourhood means, window pixels surround the central pixel. Thus, to get a value of a pixel, GEE will calculate window pixels surround it like shown in the image below. The function for reducing by neighbourhood is .reduceNeighbourhood()
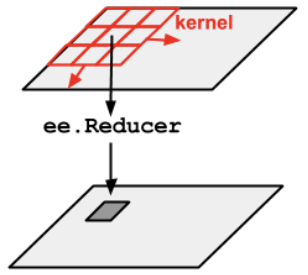
source: [GEE] (https://developers.google.com/earth-engine/guides/reducers_reduce_neighborhood)
GEE will compose a new image from the calculation result. The Image on the left is the previous satellite image and image on the right is the composite image after reducing by neighbourhood.
5.1.4.4 Reduce using Linear Regression
Biggest benefit of GEE is we can look out data from different time so we can see how pixel values change overtime. in GEE, we can do single linear regression by using linearFit() function if we want to see the change overtime in pixel values. the function takes 2 bands which is one for dependent variable and the other is the independent variable. The observation is often time. For example, we have an image collection in January and going to see temperature change overtime. The GEE will run regression pixel by pixel with time and give us output value of the regression slope. The continues values of the slope will be mapped into new image composite. therefore, this regression technic also considered as a reduce image methods because we are reducing all the stacked data into an images. The image below is the result of linear regression. The blue color show positive slope which means the band value increase overtime. Meanwhile, the red colour show negative slope that means the value decrease overtime.
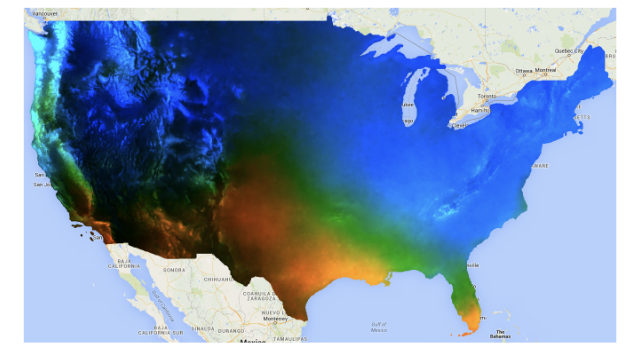
source: GEE
Other then single linear regression, GEE can also do do Multivariate Multiple Linear Regression (MMLR) that using multiple dependent variables and independent variables. Multivariate Multiple Linear Regression is a statistical test used for more than one outcome variables using one or more independent variables (Multivariate Multiple Linear Regression, no date). The methods is similar to single linear regression that it will run pixel by pixel but for all dependent variables. The only difference is MMLR will calculate covariance matrix.
The case using MMLR in GEE is usually we want to calculate 2 bands for dependent variable (outcome variables). For example, we want to model pecipitation and temperature with constant variable (or control variable) and time. Each dependent variable doing its own regression pixel by pixel then it will calculate covariance matrix. Covariance is to find the value that indicates how these two variables vary together. Covariance is like variance but using 2 variables. Covariance matrix represent covariance values of each pair of variables in multivariate data (citation: 5 Things You Should Know About Covariance).
That was all the summary of this week material about Google Earth Engine and one of the process we can do in GEE, reduce image. There are benefits and drawbacks from using this methods. To understand better about this concept, we will see some application of this process.
5.2 Application
5.2.1 Spatio-temporal Changes of Lake Surface Water Temperature
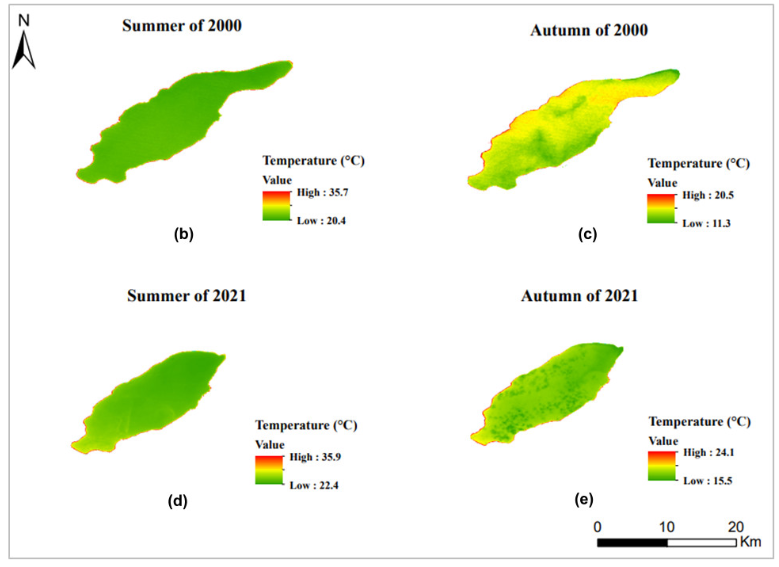
Cloud-based storage system of GEE allow us to do massive analysis with hundreds of images. This can be beneficial if we want to do study about spatio temporal changes because in GEE we can access data from multiple sensor and temporal. Albarqouni (2022), use GEE to analysis long-term spatio-temporal changes of lake surface water temperature (LSWT). To see change, this study includes 606 images from 2000 to 2021 from Landsat 5 TM and Landsat 8 OLI. 2 image sources were needed because Landsat 5 TM only collect data until 2011; thus we need Landsat 8 OLI to acquire data in 2013-2021. To calculate Water Surface Area Extraction, multispectral bands of these image collections was applied to normalized difference water index (NDWI). To measure LSWT, thermal bands was utilised to calculate Land Surface Emissivity. Then, relationship of LSWT and water surface area will be assessed. Since this analysis was conducted in GEE, the image collection was stored in the cloud.
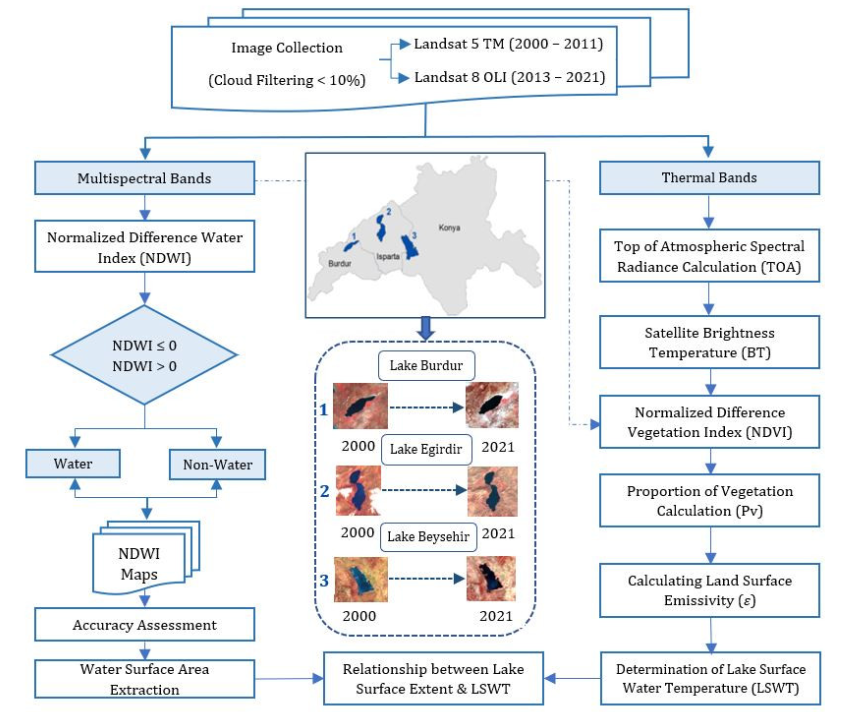
source: Albarqouni et al. (2022)
5.2.2 Forest Canopy Closure
Xie et al. (2022) takes advantages of GEE to monitoring forest changes. This study determining vegetation and bare soil endmember the normalized differences vegetation index (NDVI), modified bare soil index (MBSI), and bare soil index (BSI). This study also utilising GEE’s abilities of conducting massive analysis and providing data from various satellite. To help handle big dataset, this studyproduce image composite by reducing topographic-corrected cloudless using median reducer to pick median value in each band, in each pixel, overtime. Using image composite helps the analysis process becase it summarise the image collection into 1 image composite. This study tested the proposed methods using Landsat 8 and Sentinel-2 data. The result show that the proposed method is robust and reproducible using different sensor but with similar wavebands.
source: Xie et al. (2022)
What we can learn from this application is, various satellite data given by GEE can be combined into one analysis like what we see in LSWT research. Also, it can be treated as different input to compare the model like what we see in Forest Canopy Closure. in GEE it will be easy to access data from different tima and sensor. Although we can get image collection easily, we have to be critical to image that we get. For example, do our images require atmospheric correction? Especially regarding this example, estevezGaussianProcessesRetrieval2022, succesfully avoided atmospheric correction by assessing top-of-atmspher (TOA)
5.3 Reflection
- GEE store their datasets on clouds which makes it not require any local storage and allows to handle massive analysis with huge amount of data from multiple spectral, temporal, and sensor. We can see change with multitemporal data. We can compare the model with different input data. Ease of accessing various data can be overwhelming and prone to over-complicating, Therefore, we have to be critical on what we want to study and what kind of data that appropriate enough for the analysis.
- Since the data stored on the cloud, GEE allow us to work from anywhere. It can fit the idea of equity and justice because in developing country might does not have much geo-spatial talents. Because of the possibility to work remotely, a project team can include team member from different country
- Moreover, working with GEE we can access alot of image scene without spending anymoney. It can be beneficial for low-budget team or governemnt to save some money and alocated their money on project implementation instead.